Australian Carbon Footprint Statistics: Facts & Insights
Australia’s climate is marked by high per capita emissions in the climate sector, and its response to climate change has long been exigent. The country has one of the highest per capita emissions in the world, and its climate mitigation efforts remain a point of controversial political debate.
The nation’s carbon footprint seems out of line with its economic size and population on the global stage. Australia has among the highest domestic GHG emissions per capita as it is one of the world’s largest exporters of fossil fuels.
This article will summarise everything, including major statistics, sector breakdowns, and recommendations.
What is a Carbon Footprint?
The carbon footprint is the total greenhouse gas emissions directly or indirectly caused by an individual, organisation, event, or product. It acts as an environmental scorecard, enabling cross-comparison of climate impacts associated with different activities and entities.
We do not realise that many, if not most, of our daily activities lead to greenhouse gas emissions. We create greenhouse gas emissions from burning gasoline when we drive, burning oil or gas for home heating, or generating electricity from coal, natural gas, and oil. Greenhouse gas emissions vary among individuals based on where they live, their lifestyle and individual choices.
A few companies have mapped out their biggest emissions sources and are starting to tackle them. Approximately 59% of Apple’s carbon emissions directly result from product manufacturing, though customer energy use is also a significant part of this equation. Agricultural practices (37%), packaging (26%), and transport and distribution (11%) account for the bulk of PepsiCo’s emissions.
By understanding carbon footprints, individuals, organisations, and countries can make better choices to minimise their carbon footprint. Strategies for increased energy efficiency, reduced consumption, and transition to lower-carbon alternatives can be developed by targeting major emission sources.
Australia’s Total Carbon Emissions in 2025
Year-on-Year Change
Australia: The country’s total greenhouse gas emissions in 2024 were about 436 million metric tonnes of carbon dioxide, a small uptick from the prior year.
As of December 2023, annual net greenhouse gas emissions were 432.9 million tonnes of carbon dioxide. This was 29% lower than emissions in the year to June 2005, which is the baseline year for Australia's 2030 target under the Paris Agreement. Net greenhouse gas emissions for the year were also 0.5% down on the previous year.
OECD: Based on the entire Organisation for Economic Co-operation and Development (OECD), CO₂ emissions fell by 1.4% annually during the past decade. The emissions of non-OECD countries grew more slowly over the last decade (1.8%) than over the previous one (4.9%).
Moreover, Australia has committed to net-zero emissions by 2050 and an intermediate target to reduce greenhouse gas emissions by 43% below by 2030.
Per Capita Carbon Footprint in Australia
CO2 emissions per capita in Australia were 15.01 tonnes per person in 2022, based on a population of 26,200,984. This represents a 0.4% increase from the 2021 figure of 14.95 CO2 tonnes per person.
Source: worldometer
In a global context, Australia’s per capita emissions are high compared to many other nations. Australia is the highest emitter per capita of all OECD member countries, ranking 11th globally due to:
- Record-high levels of coal and gas generation
- Energy-inefficient buildings
- A high energy use to heat and cool homes
- Long distances add to transport emissions
- Agricultural and livestock emissions
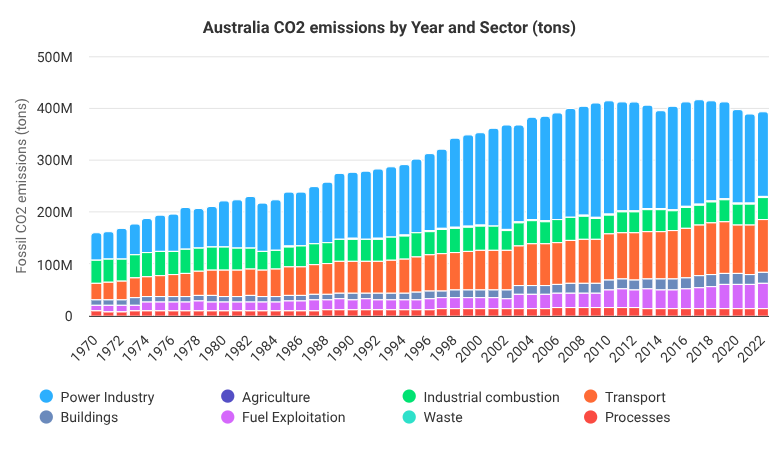
Carbon Footprint by Sector in Australia
Energy production, transport, industrial processes, agriculture, and waste management are the main contributors to Australia's carbon footprint.
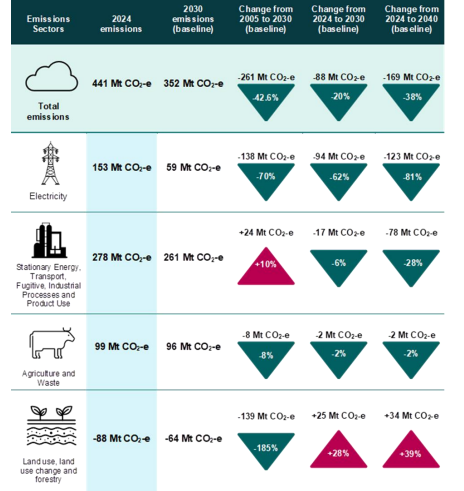
Source: DCCEEW
In both the baseline and ‘with additional measures’ scenario, projections show that from 2024 to 2040, emissions go down across almost all parts of the economy. Emissions in the electricity sector are expected to be over half lower across the six years between 2024 and 2030. Transport has been one of the fastest-growing sources (and the largest source of tectonic carbon) since 1990, except for 2020-2022, when COVID-19-related restrictions were in place.
Stationary energy, fugitives and IPPU emissions are expected to fall to 2030 as the Safeguard Mechanism incentivises investment in efficiency, fuel switching, methane capture and technology improvements. In the agriculture and waste sectors, emissions are fairly flat to 2030 and 2040. Land use, land-use change and forestry (LULUCF) will continue being a net sink in 2030 and 2040.
Emissions by State & Territory
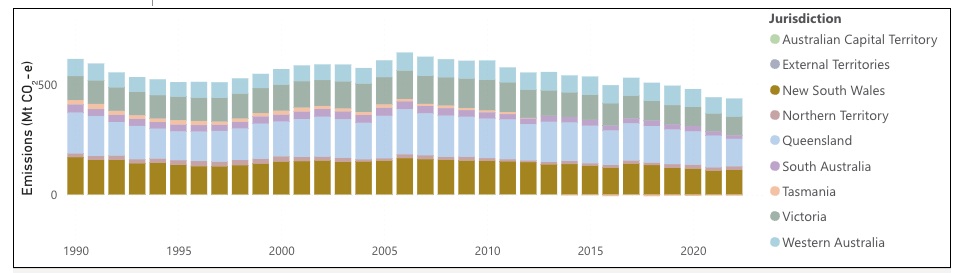
Source: DCCEEW
Queensland: The state’s total emissions in 2021-2022 were 124.1 Mt CO2-e, the largest of any state and a 35% reduction from 2004-2005, reflecting declines in land clearing. Transport emissions in Queensland have also risen 20% since 2004-2005 due to population and fleet growth.
New South Wales: Total emissions were 111.0 Mt CO2-e in 2021-2022, primarily from stationary energy, agriculture, and the land sector. Transport emissions are down 2% from 2004-2005 levels.
Victoria: The state’s emissions were 84.7 Mt CO2-e for 2021-22, down 31% from 2004-2005, predominantly due to reductions in stationary energy and land sector emissions. Victorians have also reduced transport emissions, down 2% from 2004-2005.
Western Australia: In 2021-2022, total emissions were 82.5 Mt CO2-e, an 8% increase from 2004-2005 levels. This growth was led by increased mining and exports, which resulted in greater stationary energy and fugitive emissions. Transportation emissions increased by 42% from 2004-2005 as the population and fleet of vehicles expanded.
South Australia: Its total emissions of 15.8 Mt CO2-e for 2021-22 (57% lower than 2004-2005) are predominantly driven by reductions in stationary energy and in the land sector. Electricity generation has dropped by 73% since 2004-2005.
Tasmania: The island state recorded a net sink on 2004-2005 emissions due to land sector emissions falling 128% on 2004-2005 levels primarily due to reduced native forest harvesting.
Australian Capital Territory: ACT emissions were 1.3 Mt CO2-e in 2021-22, 10% lower than 2004-2005 levels. Transport emissions in the ACT are 15% higher than 2004-2005 levels.
Northern Territory: In 2021-2022, total emissions were 16.7 Mt CO2-e, an increase of 49% from 2004-2005. The increase was due to strong growth in mining and exports, which increased fugitive and stationary energy emissions.
Waste and Rubbish as a Contributor to Carbon Emissions
Methane is produced by three major processes: bacterial decay, volatilisation, and chemical reaction. Bacteria decompose organic waste such as food, garden or green waste and paper in the absence of oxygen. This anaerobic process leads to methane production, the principal part of landfill gas, composed of 45-60% methane, 40-60% carbon dioxide, and trace amounts of other gases.
Once aerobic bacteria in the landfill exhaust oxygen, methane production begins. Several factors influence the rate and volume of landfill gas generation, including waste composition, waste age, moisture content, and temperature.
One of the many ways to divert organic waste from landfills is proper disposal and recycling, which can significantly reduce emissions. To further understand how specific waste materials like tyres contribute to Australia’s carbon footprint, and the initiatives driving recycling across states, read our full article on Tyre Waste & Recycling Statistics in Australia.
Methane emissions can also be mitigated by improving landfill management practices, including better gas collection systems and proper daily cover.
All Gone Rubbish Removals focuses on recycling and limiting waste disposal in landfills to reduce environmental pollution. As experienced rubbish removal specialists, we sort through all our collected rubbish in search of recyclable materials, which we ensure to separate and take to a recycling facility.
We reduce the amount of recyclable rubbish in landfills to promote sustainability and a greener future. We promote sustainable waste practices and extend to business elements and operations, embodying a responsible waste management approach.
Household Carbon Footprint in Australia
The average Australian household's emissions profile is due to electricity use, transport and commuting, food consumption and waste habits. Understanding these factors enables you to cut your overall carbon footprint.
Electricity Usage
Buildings are responsible for around 24% of Australia’s total electricity consumption and over 10% of the nation’s total carbon emissions. Household energy use generates some eight tonnes of carbon dioxide a year.
Factors, including the trend towards larger-sized homes and higher uptake of electrical appliances, have driven this energy consumption. White goods and electrical appliances accounted for 30% of energy consumption and 53% of household greenhouse gas emissions.
Transport and Commuting
The transport sector is Australia's third-largest emitter and contributes 21% of the nation’s emissions. Passenger cars and light commercial vehicles are responsible for 60% of transport emissions, more than 10% of Australia’s total emissions. The average Australian new car emits 182 grams of carbon dioxide per kilometre. In 2022, transport emissions totaled 90 Mt CO2-e, of which on-road vehicles represented 85% of that total.
Food Consumption
The average Australian greenhouse gas emissions were 14.5 kg CO2e per person per day. Each person in Australia produces 15.4 tonnes of CO2 per year, according to 2020 figures from Our World in Data — the latest available per capita data. That is down from 16.3 tonnes in 2019 but still thrice the world average of 4.47 tonnes.
Red meat is the biggest contributor to diet-related emissions. However, non-core foods, such as sweets, pastries, and processed meats, also contribute significantly to food-associated greenhouse gas emissions.
Waste Habits
Food waste contributes around 3% of Australia’s annual greenhouse gas emissions. Households comprised 42% of all organic waste in 2018-2019 (6.4 Mt in total), and Australians waste up to 7.6 million tonnes of food every year. Households contribute nearly 30% of the total food waste, each costing households as much as $2,500 annually.
How to Measure Your Carbon Footprint
It usually takes 5 to 10 minutes to calculate your carbon footprint on an online calculator. These calculators typically inquire about household energy use in kilowatt hours (kWh), which you can find on your energy bills. Also, consider how you use transport, including how much time you spend on trains, buses or trams and mileage if you drive.
Reducing Electricity Usage
To save energy, switch off and unplug lights and appliances when not in use, and use energy-efficient light bulbs. Energy-efficient white goods can also significantly reduce energy consumption. Making changes to transition toward clean, renewable energy sources and reduce the energy used to heat and cool buildings are also effective.
Cutting Transport and Commuting Emissions
Reducing transport-related emissions also means reducing vehicle reliance by planning ahead for trips, taking public transport options such as buses, trains, trams and ferries and walking or cycling whenever possible.
Consider consolidating errands into one trip and avoiding peak-hour traffic. Keeping vehicles well-serviced, reducing speed and acceleration, and cutting idle time can also help reduce emissions.
Mitigating Food Consumption Emissions
You could reduce your unrestricted food intake, increase your core foods, and reduce your food-related carbon footprint. Switching from beef to plant-based alternatives can also reduce greenhouse gas emissions.
Reducing Waste Emissions
To minimise waste emissions, you can cut down on plastic use and purchase recycled products or products with recycled packaging. You can also use reusable items for everyday use, including shopping bags, drink bottles, mugs, and utensils. Recycling organic waste, donating good-quality items to charity, and reducing total consumption also help.
How Recycling and Waste Removal Reduce Your Carbon Impact
Improving waste separation and reducing landfill disposal help decrease methane emissions by allowing organic waste separation, the main source of landfill-generated methane. By isolating organic material for composting or similar best practices, the volume of organic waste decay is reduced in the landfill, decreasing the volume of released methane.
Hiring a rubbish removal service provides waste management solutions. It covers different types of waste and helps to avoid negative environmental impacts or threats to human health. Moreover, it is time and labour-saving and provides flexible and economic solutions to individual needs.
All Gone Rubbish Removals Services care about the environment by properly categorising rubbish for recycling, donation, and safe disposal. Our sustainable practice eases the pressure on landfills and prevents the time and energy involved in separating and recycling waste. Hiring us ensures you are decluttering the environment in an eco-friendly manner.
We provide same-day rubbish removal services across Sydney, the Central Coast, Gosford, Newcastle, and the Gold Coast. Call us today for your area's best-priced rubbish removal service!
Carbon Footprint Statistics by Industry in Australia
Below is a breakdown of the carbon footprint contributions of the Australian construction, mining, retail and logistics industries. These sectors are large components of the countrywide emissions profile, and each faces its own unique challenges and opportunities for decarbonisation.
Construction Industry
In 2023, 10% of Australia's total carbon emissions came from construction activities, with upfront carbon at 7%. Buildings and infrastructure directly account for almost a third of Australia’s total carbon emissions and indirectly for more than half, with emissions embedded in everything produced, moved and consumed. Buildings accounted for the biggest share of embodied carbon from 2022 to 2023 (21 Mt CO₂e), with transport infrastructure (10 Mt CO₂e) and utilities (5 Mt CO₂e).
Mining Industry
Mining was responsible for 23% of the country’s total emissions in 2022, with the resources sector emissions comprising 99 million tonnes of carbon dioxide. Fugitive emissions from coal mines and diesel fuel burned at mines are major contributors. Mining accounted for 6.2% of Australia’s energy demands and 9.5% of greenhouse gas emissions 2019. The mining sector has a national benchmark to cut emissions by 43% from 2005 by 2030 and reach net zero by 2050.
Retail Industry
The retail sector is responsible for approximately 50% of energy consumption in the commercial property sector and 5% of Australia’s greenhouse gas emissions. The national emissions contribution from retail is relatively small at just 5% of the total, but retail is one of the country's most energy-intensive industries.
With the retail sector accounting for the lion's share of the nation's total emissions, cuts are essential if Australia is to meet its climate change targets. Over 90% of a total business carbon footprint comes from supply chain emissions, which dominate emissions in the retail sector.
Logistics Industry
In 2023, the transport sector, logistics, is the third-largest emitter in Australia, producing 21% of national emissions. Freight transport is responsible for an estimated 20% of the emissions from the transport sector.
In road transport, the share was 31%, while rail and ships contributed 57% and 12%, respectively, in domestic freight transport during 2022-2023. As the global economy evolves, logistics operations are responsible for a significant portion of global greenhouse gas emissions, as transportation alone accounts for almost 25% of emissions globally.
Australia's Carbon Footprint Trends: Is It Getting Better or Worse?
In the last five to ten years, Australia has experienced a fluctuating and reflective trend of carbon emissions.
However, emissions have largely recurred following a drastic decline in 2020 influenced by different sectors and government strategies. Although some states have made strides in adopting renewable energy, the country's commitment to emissions reductions has seen both progress and setbacks.
As a party to the Paris Agreement, the Australian Government has pledged a 43% emissions reduction by 2030. However, reliance on fossil fuels is still high, undermining these targets, and Climate Action Tracker judges Australia’s overall commitment to emissions reduction as “insufficient”.
Likewise, the government developed a Net Zero Plan to attain net zero emissions by 2050, necessitating innovation and investment across all sectors. The Plan will be complemented by sectoral emissions reduction plans, with the following six industries namely: electricity and energy; agriculture and land; the built environment; industry; transport and infrastructure; and resources.
The Climate Change Authority (CCA) provides independent advice to ensure the best available information underpins the Plan and the 2035 target. The government also consults with communities, industries, investors, academia and unions to ensure the plan is credible and deliverable.
Frequently Asked Questions
1. What will Australia’s carbon footprint statistics be in 2025?
According to Australia's 2024 emissions projections, given current policies, Australia is on track to reduce its greenhouse gas emissions by 42.6% below 2005 levels by 2025.
2. Why is Australia’s per capita CO₂ so high?
Australia's per capita CO₂ emissions are among the highest in the world, driven largely by its legacy of electricity generation from coal and gas and exports of fossil fuels. These carbon-intensive energy sources have long made up the backbone of its energy infrastructure and have greatly contributed to substantial emissions.
3. Which state produces the most emissions?
Queensland has the largest proportion of Australia's total greenhouse gas (GHG) emissions at 27.3%
4. How does landfill rubbish cause emissions?
Greenhouse gas emissions from landfill waste occur through various processes related to organic material decomposition.
5. Can rubbish removal help lower my carbon impact?
Yes, responsible rubbish disposal methods such as waste reduction, recycling, and eco-friendly junk removals can reduce your carbon footprint by a considerable amount.
Driven by a passion for helping customers achieve clutter-free spaces, All Gone Rubbish Removals has become a go-to resource for waste management, featuring over 100 expert articles on rubbish removal and sustainability. Aaron’s dedication to efficiency and customer satisfaction ensures his business remains a leader in the industry.
- Is Fibro Asbestos? Understanding The Difference - July 14, 2025
- Household Hot Water Tank Disposal in Sydney - July 14, 2025
- Garage Clean Out & Clearance Services Sydney - July 14, 2025